What is ABAP Debugger ? and How to Debug SAP ABAP Program
What is ABAP Debugger ? and How to Debug SAP ABAP Program
ABAP Debugger is a programming tool which we can use to execute ABAP programs, by line or by section. Using ABAP Debugger ,we can check the flow logic of programs.
There are two Types of Debugging are available:
Classic Debugger
New Debugger
The Classic ABAP Debugger displayed in the same window as the application which also has some restrictions. Some ABAP programs (such as conversion exist) cannot be analyzed in debug mode for technical reasons.
Classic Debugger Functions:
Breakpoints
Static Breakpoints
Dynamic Breakpoints
Breakpoints at Statements
Breakpoints at Subroutines
Breakpoints at Function Module Calls
Breakpoints at Methods
Breakpoints at System Exceptions
Saving Breakpoints
Managing Dynamic Breakpoints
Watchpoints
If you want to interrupt a program when the contents of a field or structure change, use a watchpoint.
You can set up to five watchpoints, including watchpoints for strings.
A watchpoint can be either local or global.
Local watchpoints are only valid in the specified program.
Global watchpoints are valid in the specified program, and also in all the other programs it calls.
To set a watchpoint, start the Debugger and proceed as follows:
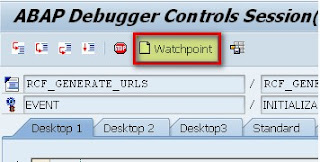
Choose Breakpoint → Create watchpoint or the corresponding push button
Setting Watchpoints
Specifying Logical Links
Changing Watchpoints
Memory Monitoring with Watchpoints
Analyzing Source Code
Displaying the Source Code
Stepping Through the Source Code
Processing Fields
Processing Internal Tables
Attributes of Data Objects
Displaying OO Objects
Other Functions
Displaying Lists
Call Links
Debugging in Production Clients
Releasing Database Locks
Settings and Warnings
Memory Use
Memory Analysis
Sessions
The New Debugger provides the user with a flexible interface that can be configured as required and has more than eight desktops. Here it is possible to place and arrange up to four tools - depending on the user's selection. For example, it is possible to display source texts or structures. In this way, the user can design the Debugger interface according to his own individual requirements.
New Debugger Functions:
Control
Watchpoints
Breakpoints
Analyzing Source Code
Tools
Data Explorer
Screen Analysis
Breakpoints/Watchpoints and Checkpoints
Editor
Stack
Overview of Variables
Structure Display
Table Display
Object Display
Detailed Display
Editor (Edit Control)
Diff Tool
Loaded Programs (Global Data)
System Areas
User Interface
Layout of the User Interface
Designing Work Areas
Other Functions
System Debugging
Debugging in Production Clients
Error Handling
We can switch between classic Debugger or the new Debugger in the ABAP Editor from the path
Utilities → Settings.
Debugging SAP ABAP Programs
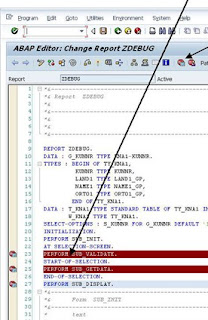
We are starting the debugging by putting the break points at any statements of in the active ABAP Source code and executing program ,then system starts debugging window in which we can find all variables values and structure components and further we will know the flow of Program.
Second Way:
If you are not familiar with debugging, which line of code you want to debug, enter some transaction code and enter /H in the command prompt and Press Enter to activate the debugger. Debugger will be triggered automatically.
We can set two kinds of breakpoints in the ABAP Source Code.
Static Breakpoints: These can be set by using statement BREAK-POINT in ABAP code, these breakpoints are not user specific, these will trigger for every user. We need to delete these breakpoints manually.
Report zdebug.
....
if SY-SUBRC <> 0.
break-point.
endif.
Dynamic Breakpoints: These breakpoints are user specific, these will trigger for specific user only. These breakpoints will be deleted automatically when you log-off from SAP.
Dynamic breakpoints are of two types.
External break-point: It will get activated even for Non SAP Applications, these breakpoints will be triggered from SAP or from Non-SAP example from portal screen.
Set it through Utilities - Setting - breakpoints.
Session break-point: This break-point will be activated for call only within SAP system and its active till the User session is on.
What are F5, F6, F7 and F8 Keys(functions) in debugging ?
These are function keys are used to control debugging
F5 - When we press F5 in debugging, you will go to next step means you program control goes to next line.
F6 - When you press F6 in debugging, it will execute the module without going into it. F6 works for performs (subroutines), Function modules, Class methods etc.
F7 - When you press F7 in debugging, it will completes the current module/program in a single step.
F8 - When you press F8 in debugging, control will go to next break point if any or completes the program execution.


Thank you for sharing this! What you have shared is very helpful and informative. Would love to see more updates from you.
ReplyDeleteWebsite Development